Not Exactly Home Free

Exploring home prices and incomes
Excel | QGIS | Illustrator | InDesign

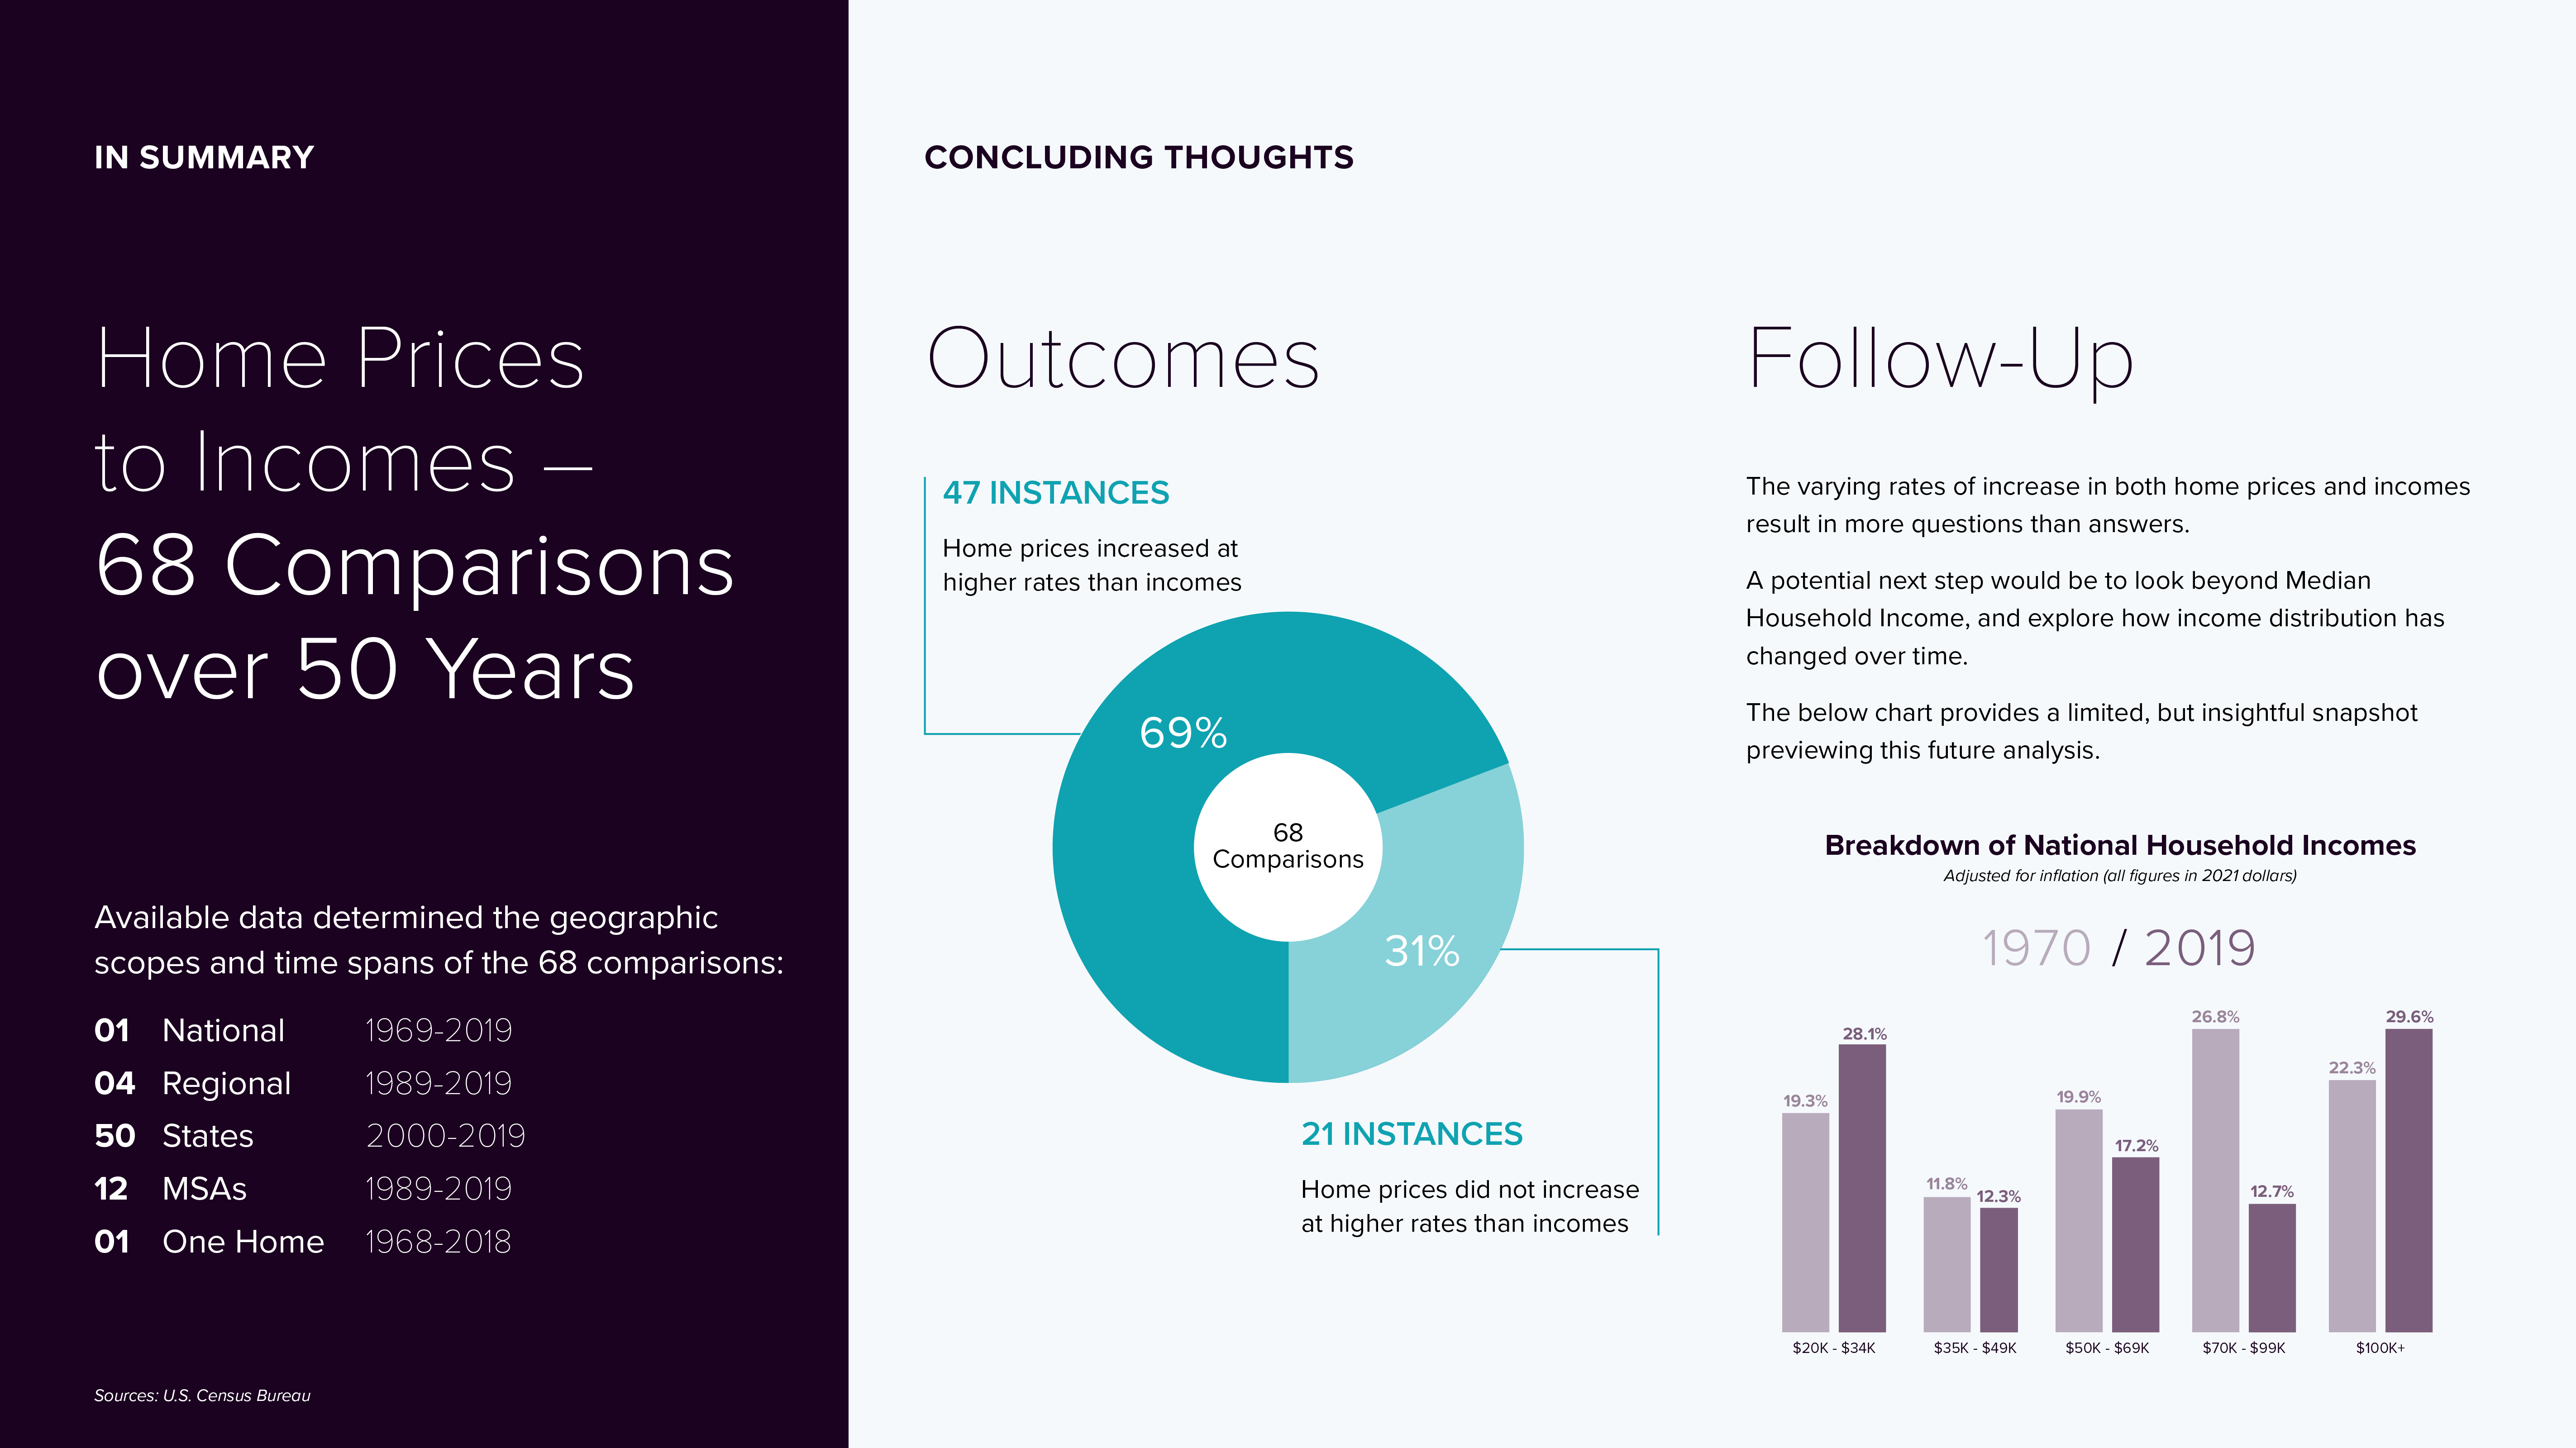
RESEARCH QUESTION How have US home prices increased as compared to household incomes? A simple enough question, but not without nuance...

DATA DEFINITIONS AND LIMITATIONS
SINGLE FAMILY HOME PRICE Reflective of sale prices for single family homes and does not include multi-family properties, condos, or co-ops - inevitably limiting the available data for urban areas.
HOUSEHOLD INCOME Does not take into account the number of people living in one household, thus neglecting to address that one person living on an income of $50,000 has very different circumstances than someone supporting a family of four on that same income.
GENDER AND RACE Incomes are inclusive of all genders and races, and as such, fail to reflect how both gender and race impact incomes.
MSA A Metropolitan Statistical Area (MSA), as determined by the US Office of Management and Budget, is a region that consists of a city and surrounding communities that are linked by social and economic factors, ranked in order of highest population.
IT'S PERSONAL The story of home ownership in America is far too complicated for any line graph to fully tell. In an effort to capture some of the nuances of the story, I've included personal data on the home I grew up in.
Line graph: mdeian single family home prices and median household incomes in the United States (1969-2019); median home price increased 80.0%; median household income increased 17.6%; home prices increased 4.6x the rate of imcomes
Line graph: mdeian single family home prices and median household incomes in the New York City (1989-2019); median home price increased 17.8%; median household income increased 3.5%
Line graph: mdeian single family home prices and median household incomes in the Los Angeles (1989-2019); median home price increased 38.0%; median household income increased 1.2%
Line graph: mdeian single family home prices and median household incomes in the Chicago (1989-2019); median home price increased 29.5%; median household income increased 1.7%
Line graph: mdeian single family home prices and median household incomes in the Dallas (1989-2019); median home price increased 39.5%; median household income increased 15.4%
Line graph: mdeian single family home prices and median household incomes in the Houston (1989-2019); median home price increased 78.7%; median household income increased 21.2%
Line graph: mdeian single family home prices and median household incomes in the Washington, D.C. (1989-2019); median home price increased 51.3%; median household income increased 11.2%
Line graph: mdeian single family home prices and median household incomes in the Miami (1989-2019); median home price increased 106.4%; median household income decreased 1.2%
Line graph: mdeian single family home prices and median household incomes in the Philadelphia (1989-2019); median home price increased 17.5%; median household income increased 2.2%
Line graph: mdeian single family home prices and median household incomes in the Atlanta (1989-2019); median home price increased 34.7%; median household income increased 2.4%
Line graph: mdeian single family home prices and median household incomes in the Phoenix (1989-2019); median home price increased 76.7%; median household income increased 15.7%
Line graph: mdeian single family home prices and median household incomes in the Boston (1989-2019); median home price increased 42.6%; median household income increased 11.9%
Line graph: mdeian single family home prices and median household incomes in the San Francisco (1989-2019); median home price increased 83.8%; median household income increased 35.3%
Line graph: the house I grew up in: home value and household income (1968-2018)
Unites States by region; median single family home prices and median household incomes (1989-2019); Northeast home prices 9.9% higher; Northeast incomes 10.9% higher; Midwest home prices 21.9% lower; Midwest incomes 0.5% lower; South home prices 11.9 lower; South incomes 9.9 lower; West home prices 47.6% higher; West income 10.3% higher
Unites States by states; median single family home prices and median household incomes (2000-2019); Alabama - Kansas; notable: AK 2019 home price = 5.4x income; CA 2019 home price = 10.4x income; CO 2019 home price = 5.3x income; DC 2019 home price = 9.8x income; HI 2019 home price = 13.0x income
Unites States by states; median single family home prices and median household incomes (2000-2019); Kentucky - North Carolina; notable: NY 2019 home price = 5.1x income
Unites States by states; median single family home prices and median household incomes (2000-2019); North Dakota - Wyoming; notable: OR 2019 home price = 6.1x income; UT 2019 home price = 5.2x income; WA 2019 home price = 5.0x income
in summary: home prices to incomes - 68 comparisons over 50 years; outcomes: 69% (47 instances) home prices increased at higher rates than incomes; 31% (21 instances) home prices did not increase higher than incomes; follow up: look at change income breakdown over time
sources US Census Bureau , Zillow , National Association of Realtors Research Team , My mother's personal records, memories, and persistent calls to Town Hall
BACK NEXT